01One number is not enough
"Java on Lambda is slow." True. The question is by how much, where, and from when on it stops being true.
Most cold-start posts out there benchmark a Hello World with a 1 KB payload and slap a headline on top. That helps nobody facing a real choice between Quarkus JVM, Quarkus Native, Node.js, and SnapStart. So I measured it myself, cleanly, with clear methodology and no marketing layer.
What you get in this post: hard numbers from eu-central-2 (Zurich), arm64, four runtimes side by side, plus two findings that haven’t been in the AWS blog posts so far.
02Setup, briefly
Few variables, many repetitions.
Same workload in all four runtimes: JSON in, validate UUID, SHA-256 over the payload, write to DynamoDB, read back, JSON out. Identical in Quarkus 3.34 and Node 24. The Java codebase is a single source; the only difference is mvn package versus mvn package -Dnative.
- Region: eu-central-2 (Zurich), arm64 (Graviton)
- Runtimes: Quarkus JVM on Java 25, Quarkus Native via GraalVM, Node.js 24, JVM with SnapStart
- Memory: 512, 1024, 1769 MB (1769 equals 1 vCPU)
- Payloads: 1 KB, 100 KB, 1 MB
- Iterations: 50 cold + 50 warm per config (25 + 25 for SnapStart)
- Forcing cold starts:
update-function-configurationwith a nonce env var, thenwait function-updated - Measurement source: REPORT line from
aws lambda invoke --log-type Tail, no waiting for CloudWatch ingestion - Code and data: full repository at github.com/k-i-soft/lambda-coldstart-bench, including the raw CSVs from every run under
results/raw/
java25). Quarkus itself doesn't bundle a JVM, it is just the framework. "Quarkus Native" is compiled via GraalVM/Mandrel into a static binary, with no JVM underneath, running on the custom runtime provided.al2023. If you want a different JDK vendor (Temurin, Zulu, Liberica) you have to roll your own custom runtime, which is out of scope for this study.
Deliberately not measured: VPC Lambdas (different cold-start profile), Provisioned Concurrency (no cold start to measure), Lambda@Edge (different stack). Honest caveats matter more than broad claims.
The tables below show 1 KB payload p50 numbers. 100 KB and 1 MB data follow the same shape and are in the repo CSVs.
03Init Duration: memory is (almost) irrelevant
First surprise comes from the pure initialization times.
If you expect more memory to speed up cold start because Lambda allocates CPU proportionally to memory, that’s only true for one of the four runtimes. For the other three, init duration is remarkably flat.
| Runtime | 512 MB | 1024 MB | 1769 MB |
|---|---|---|---|
| Quarkus JVM | 1109 | 1112 | 1125 |
| JVM with SnapStart | 941 | 705 | 658 |
| Quarkus Native | 390 | 387 | 390 |
| Node.js 24 | 320 | 316 | 319 |
Cold start init duration p50 (ms), 1 KB payload.
Quarkus JVM needs ~1100 ms regardless of 512 or 1769 MB. Native stays around ~390 ms, Node around ~320 ms. More CPU does not help with class loading or CDI bootstrap.
The only exception is SnapStart, whose Restore Duration does scale with memory. Plausible reason: snapshot deserialization is CPU-bound, more memory means more threads doing the unpacking.
First takeaway: if your bottleneck is genuinely init, more memory will not save you. You have to switch runtime.
04Total cold duration: this is where it tilts
Init Duration is only half the story. What the user actually feels is init plus first execution.
The JVM has a second problem that init duration doesn’t show: the JIT only compiles on the first real invocation. That compile work shows up as Duration in REPORT, not Init Duration. And it scales with available CPU.
| Runtime | 512 MB | 1024 MB | 1769 MB |
|---|---|---|---|
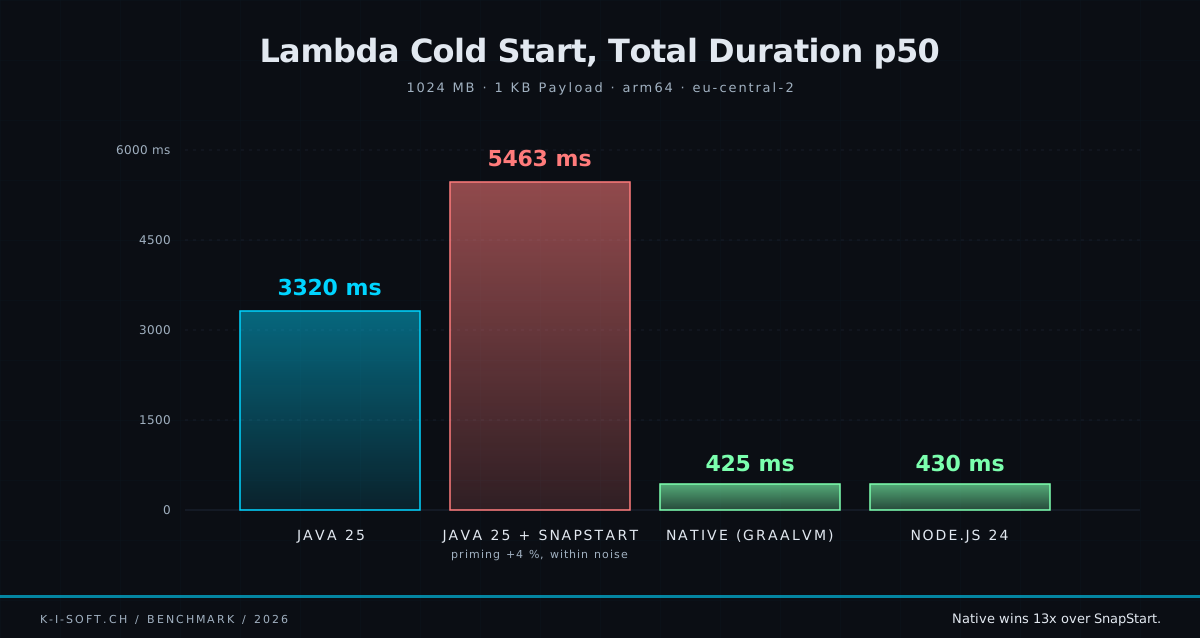
| Quarkus JVM | 5778 | 3320 | 2397 |
| JVM with SnapStart | 10315 | 5463 | 3553 |
| Quarkus Native | 437 | 425 | 432 |
| Node.js 24 | 541 | 430 | 407 |
Cold start total duration p50 (ms), 1 KB payload (init + first execution).
Here something important happens: Quarkus JVM at 512 MB needs 5.8 seconds to first response. At 1769 MB it’s still 2.4 seconds. More CPU lets the JIT work faster and pulls total cold latency down sharply.
Native and Node play in a completely different league, both under 600 ms, because there’s no JIT compile phase. Between Native and Node, only the bit of bootstrap overhead remains. Native is even slightly faster on total cold.
The key finding: more memory only helps indirectly, through the JIT, not through init. If you live with JVM on Lambda and need sub-second cold starts, you have to go beyond 1769 MB or switch to native.
05Warm: everything converges
Once containers are warm, the difference almost disappears.
| Runtime | 512 MB | 1024 MB | 1769 MB |
|---|---|---|---|
| Quarkus JVM | 23 | 14 | 15 |
| JVM with SnapStart | 51 | 21 | 17 |
| Quarkus Native | 11 | 11 | 10 |
| Node.js 24 | 10 | 11 | 10 |
Warm duration p50 (ms), 1 KB payload.
Native and Node at 10-11 ms, JVM at 14-15 ms, SnapStart slightly behind. With warm containers, runtime choice is almost performance-irrelevant. The whole cold-start debate reduces to the init profile and the first one or two invocations.
Practical conclusion: if your function gets enough traffic to stay warm, JVM on Lambda is fine. If it runs sporadically (webhooks, cron triggers, low-latency requirements on the first request), you need Native or Node.
06SnapStart, the unexpected loser
AWS markets SnapStart as 10x faster cold starts for Java. My naive out-of-the-box measurement says: without priming, it's actually slower than standard JVM.
Look at table 04 again: SnapStart total cold at 512 MB is 10315 ms, almost twice as long as standard JVM at 5778 ms. At 1024 and 1769 MB, SnapStart is also behind.
How can that be? Restore Duration (table 03) is clearly better than Init Duration, so what’s going wrong?
The mechanic explains it: Lambda takes the snapshot right after Quarkus’ init phase, before the JIT has seen any handler code paths. On restore, Lambda jumps straight into handler execution. The JIT is at zero. Plus: AWS SDK connections inside the snapshot are dead sockets, the DynamoDB client has to reconnect from scratch.
The result: restore is fast, but the first invocation costs more than a standard JVM cold start, because the standard cold start at least had its init loop compile a few paths.
org.crac.Resource, registers itself at boot, calls itself once before the snapshot). Cold total at 1024 MB / 1 KB: 5698 ms primed vs 5463 ms unprimed. 4 percent delta, within measurement noise. Priming did not help in this configuration.
Why? AWS SDK connections in the snapshot are dead after restore. The first invoke after restore has to build a fresh TCP connection to DynamoDB, do a TLS handshake, and resolve the endpoint, regardless of whether priming ran. JIT compilation and class loading, which the snapshot does preserve, evidently do not contribute enough to first-invoke cost. The expensive parts (network setup plus AWS SDK connection state) are structurally not primable.
Pragmatically: flipping SnapStart on and adding priming is not enough in our setup. On a DDB-roundtrip-heavy workload SnapStart cannot deliver on the promise. The “10x faster with priming” claim applies to workloads that are mostly local (CPU-bound, not IO-bound). Once external services sit in the hot path, native remains the more reliable path to sub-second cold starts.
07What to take away
Four recommendations, all derived from the data above.
- Cold-start critical and sporadic: Quarkus Native or Node. Sub-second cold, no JIT risk, comparable engineering effort
- High traffic, container stays warm: any of the four runtimes is fine. Pick by team skill and ecosystem, not by cold-start marketing
- JVM on Lambda: at least 1024 MB, ideally 1769 MB. At 512 MB the JIT phase is brutal
- SnapStart: only with priming. Turn it on naively and it makes latency worse, not better
And one final note: arm64 over x86. All measurements above run on Graviton. You save money and get slightly better numbers. In 2026 there’s no good reason left for x86 Lambda, except for legacy libraries not built for arm64.
08Caveats: what makes priming hard
Priming sounds easy. The moment you actually use it, you learn the lifecycle details.
What we did above: the handler implements org.crac.Resource, registers with CRaC Core, and calls itself in beforeCheckpoint with a dummy payload. Lambda triggers that before snapshot creation, JIT and SDK connections end up inside the snapshot, the first invoke after restore jumps straight into warm code.
Sounds clean. It’s actually delicate in several spots:
- Real call, real side effects. Our priming writes a dummy item with id
00000000-0000-0000-0000-000000000000to DynamoDB. One row per published version lands in the table. For a real system you either build a separate priming path that does not hit your real data, or filter the dummies out later - Connections in the snapshot are dead after restore. TLS sessions, sockets, HTTP keepalives are valid at snapshot time. Hours later at restore, nothing on the other end is listening anymore. The AWS SDK v2 mostly reconnects lazily, but not always cleanly. Classic JDBC drivers over TCP usually need explicit reconnect
- SecureRandom must be reseeded. If the snapshot contains a seeded
SecureRandom, all restored instances generate the same sequence. UUIDs collide, JWT IDs collide, sessions collide. Lambda handles this for the default SecureRandom, but only that one. Your own RNGs must be reseeded inafterRestore - Cache contents go stale. In-memory caches in the snapshot are still there after restore, but their data may be outdated. Something a normal cold start avoids (empty cache after init) becomes a real problem with SnapStart
- Priming exceptions block the snapshot. Any unhandled exception in
beforeCheckpointpropagates and fails snapshot creation. We swallow everything (try { ... } catch (Exception ignored) {}), which is pragmatic but masks real problems. In production you at least want to log and alert - Deploy time increases. Every publish-version now goes through init plus priming plus snapshot. Instead of 5-10 seconds you count 20-40. With canary releases or blue-green switches that adds up across all functions
- Test coverage gap. Priming code runs in a different lifecycle than handler code, and in most test setups it does not run at all. Refactor the handler, rename a class, and the change in
beforeCheckpointmay only show up on the first cold restore in production
Pragmatically: priming is not an on-off switch. It is a deliberate architecture decision with its own maintenance cost. If you cannot carry that, Quarkus Native or Node is calmer and free of restore-time surprises.
09Caveats: native builds and the reflection trap
In the cold-start tables, native looks like the clear winner. The build does the homework that makes it possible, not the runtime.
GraalVM native-image is ahead-of-time compilation: your code, your libraries, the runtime, all compiled to a static binary at build time. The big upside is startup under 100 ms (in the Quarkus best case) and a low memory footprint. The price is the “closed-world assumption”: everything that can run at runtime must be visible at build time. Whatever the compiler does not see is not in the image. Period.
What that means in practice:
- Reflection is the main trap. Classes only reached via
Class.forName(),getDeclaredField(), or similar reflective APIs are missing from the image by default. The build does not crash, the binary runs, but at runtime you get aClassNotFoundExceptionorNoSuchFieldException, often deep inside some library, often only on a production code path your tests never covered - Gson is the classic example. Gson serializes and deserializes via reflection on fields. Without reflection hints it cannot find your classes and either returns empty objects or crashes at runtime. Workaround:
@RegisterForReflectionon every bean Gson touches, or switch to Jackson, because the Quarkus Jackson extension ships the reflection configs - Jackson, Hibernate, JAX-RS, Quarkus-native code all work fine because the respective extensions generate the reflection configs at build time. The moment you use a library for which no Quarkus extension exists (a niche crypto lib, a custom XML parser, an in-house ORM), you are on your own. That’s the spot where native migrations typically get stuck for weeks
- Dynamic proxies, resources, Java serialization all need their own configuration. Resources (
application.propertiesis in by default, yourconfig.jsonis not) you register via-H:IncludeResourcesor the Quarkus equivalents. Java serialization needs an explicit list of serializable classes, otherwise class-not-found at runtime - JNI libraries are problematic. Dependencies with native-glibc bindings (some crypto libs, certain XML parsers, old file-IO wrappers, JNI-based DB drivers) get you linker errors at build time or runtime crashes. Some libraries simply are not native-image-compatible
- Tracing Agent as first aid. GraalVM ships a tracing agent that records, during a normal JVM run, which reflection and which resources are actually used. Output is a
reflect-config.jsonyou feed into the build. Works well, but only for code paths your tests actually exercise. Anything tests don’t run won’t be in the image. Coverage suddenly becomes a build-safety question, not just a quality question
Plus the build reality, which has nothing to do with runtime:
- Build time: 5-15 minutes for Quarkus native, versus 30 seconds for JVM. In CI you plan a separate pipeline stage for it, otherwise it blocks every pull request
- Build RAM: native-image needs 8-12 GB RAM at compile time. CI runners with 4 GB OOM the build
- Container build: cross-compile (linux/arm64 binary from macOS) requires Docker or Podman with the right builder image.
quarkus.native.container-build=truemakes it transparent but costs you the image pull on first run (~1.5 GB Mandrel image) - Debugging is different: no JMX, no
jmap, nojstack, no live profiling with the usual tools. Stack traces are shorter because many methods got inlined.-ghelps at the cost of a bigger binary - Peak throughput: AOT optimizations are static. The JIT in a warmed-up JVM can adaptively optimize and beats the native binary on long-lived workloads, often by 10-30 percent. On Lambda with short sessions that’s irrelevant, for long-running services it can matter
- Version lock-in: the native binary is built against a specific GraalVM JDK version and a specific glibc/Linux image. A Lambda runtime switch (e.g. Amazon Linux 2 to 2023) requires a rebuild, otherwise you hit linker errors. That’s a binding you have to track in a multi-service stack
My practical flow: JVM mode in dev and CI tests (fast build cycle, full debug comfort, fast feedback), native only for the final build that ships to Lambda. Quarkus makes that simple via the same Maven profile, the same code state is validated both sides. Reverse it and build native exclusively, and you lose the fast iteration loop and only catch reflection problems in CI.
What native structurally does not have: snapshot/restore issues. There is no snapshot. Every cold start initializes connections fresh. There is no dead pool sitting in memory. What is a burden for SnapStart (“stale state after restore”, see Section 06) simply does not apply to native. On IO-heavy workloads (DDB, RDS, other AWS services in the hot path) that distinction is decisive, and priming cannot bridge it.
10Side-by-side comparison
Three runtimes, ten aspects. Which row is the deciding one depends on your workload.
| Aspect | Quarkus JVM | JVM with SnapStart | Quarkus Native |
|---|---|---|---|
| Build time | ~30 s | ~30 s | 5-15 min |
| Build setup | JDK | JDK | 8-12 GB RAM, Mandrel container |
| Handler change | none | CRaC hook plus priming path | maybe @RegisterForReflection |
| Cold init/restore p50 (1024 MB) | ~1100 ms | ~700 ms | ~390 ms |
| Cold total p50 (1024 MB, 1 KB) | 3320 ms | 5463 ms* | 425 ms |
| Warm p50 (1024 MB, 1 KB) | 14 ms | 21 ms | 11 ms |
| Reflection | fine | fine | hints required |
| Library compatibility | full JVM | full JVM plus CRaC awareness | native-compatible only |
| Debugging | JMX, jstack, JFR | JMX, JFR | heavily constrained |
| Deploy per version | ~5 s | ~20-40 s (snapshot) | ~5 s |
| Lambda runtime | java25 |
java25 with SnapStart |
provided.al2023 |
| Maintenance burden | low | medium (priming lifecycle) | medium (reflection, build pipeline) |
* Value from the measurement without CRaC priming. A second run with priming enabled gave 5698 ms (1024 MB / 1 KB), so +4 percent within measurement noise. Priming did not help in this configuration, see Section 06 for the why.
If you compare just one row: Cold total at 1024 MB. That’s the time your user sees between clicking and the response on a cold function. Native wins by a factor of 8 over JVM and a factor of 13 over SnapStart. CRaC priming did not measurably improve the SnapStart number, because connection state has to be rebuilt after restore, and that is the dominant first-invoke cost.